


So what is a visual model in math? It’s any drawing, diagram or pile of objects that lets you look at a problem instead of only reading it. Plain numbers are easy to lose track of, and a picture holds them still. Draw three rows with four dots in each, count them up, and you’ve got 3 × 4 = 12 without anyone lecturing you about multiplication.
I watched this happen in a fourth-grade room once. A girl sat frowning at a word problem about shared pencils, pen hovering, nothing written. Her teacher sketched a lopsided rectangle on the board, split it in two, and the girl said “oh” out loud. That was it. The rest of this guide covers the main kinds of visual models, a few solved examples, and a quick way to pick the one that fits when you’re stuck.
What Is a Visual Model in Math?
A visual model is a picture, sketch or arrangement of objects that stands in for a math idea. Scrap-paper doodle, diagram on a screen, pile of blocks on a desk: all of these count, as long as each piece means something. One part might be a number, another a group, another a slice of a whole, and one might be the unknown you’re trying to find.
That’s the line between a model and decoration. Say a worksheet shows five cartoon apples next to the numeral 5. Nice to look at, but the apples add nothing, so it’s just an illustration. Now take a ten frame with five dots in it. The five empty boxes tell you how many more you need to make ten, so the layout itself is doing the explaining. That’s a model.
Teachers often describe learning in three steps: concrete, pictorial, abstract. First children handle real things like counters or cubes. Then they draw those same things. Only after that do they write equations with symbols. The visual model lives in the middle step, and it’s what gets a child from the objects to the equation.
One thing to keep apart: this isn’t a “mathematical model” in the sense of equations built to predict traffic jams or population growth. That’s a different field. This guide sticks to the drawings and diagrams used for everyday arithmetic, fractions and early algebra.
In short, a visual model in math is a diagram, drawing or set of objects that lets you see how numbers and operations relate, without having to take anyone’s word for it.
Why Visual Models Matter in Math
Rules you’ve only memorized tend to slip away. Plenty of students can recite “multiply the tops, multiply the bottoms” and still can’t say why the answer comes out smaller. A visual representation in mathematics gives that rule something solid to stand on.
- The “why” behind the answer. Set out 4 rows of 5 objects and you can count the 20 yourself. No one has to tell you it’s right.
- Word problems lose their wall of text. Draw one long bar for the total and split it into parts. Before you’ve done any arithmetic, you’ve had to decide what’s known and what’s missing.
- Symbols come more easily. Blocks turn into a sketch, and the sketch turns into an equation without much of a leap.
- Errors stand out. A fraction bar with uneven pieces looks off long before you start calculating.
A caution, though. A diagram doesn’t teach on its own. It works when a teacher or parent says what each part stands for and then ties it back to the written math. Hand a child a picture and walk away, and not much usually happens.
The Main Types of Visual Models in Math
Different problems call for different pictures. These are the ones you’ll see most in elementary and middle school, each with an example.

1. Number Lines
Picture a straight line with the numbers lined up in order. That’s all a number line is. To add, you walk right. To subtract, you walk back the other way.
Multiplication works as repeated hopping. Say you want 6 × 3. You start at zero and keep hopping three spaces, and by the time you’ve made six hops your pencil has touched 3, 6, 9, 12 and 15 before it comes to rest on 18. That’s six groups of three, which is how the product ends up being 18.
Now rounding. Take 7,380 and say you need it to the nearest thousand. Sketch a line with 7,000 on the left and 8,000 on the right, then pencil in 7,380. It lands a little over a third of the way across, nowhere near the middle. The gap back to 7,000 is 380, and the gap forward to 8,000 is 620. Round down to 7,000.
Comparing. Whatever is further right is bigger. This saves a lot of confusion with decimals. On the line, 0.4 lands to the right of 0.35, even though 35 looks like the bigger number.
Number lines work for fractions and negatives as well. Put 1/2 halfway between 0 and 1. Or start at 2 and move 5 units left, and you end up at −3. Hardly any other tool stretches this far, which explains why number lines hang around from kindergarten right up to algebra.
2. Arrays
An array puts objects into equal rows and columns. It’s probably the most direct picture of multiplication out there, because the total is just rows times columns.
Four rows with five dots in each makes 20, so 4 × 5 = 20. Now tilt the page a quarter turn. The same dots form 5 rows of 4, and the total hasn’t moved. This is why the order of the factors doesn’t matter in multiplication, an idea teachers call the commutative property.
Division comes out of the same picture, though you have to run it backwards. Take 24 counters and deal them into 6 rows, like cards around a table, until none are left. Every row ends up holding 4. So 24 ÷ 6 = 4. Count the dots by rows or by columns and the same three numbers keep turning up, which gives you 6 × 4, 4 × 6, 24 ÷ 4 and 24 ÷ 6 as one family of facts.
Repeated addition fits in here as well. Adding 5 + 5 + 5 + 5 means going down the rows and adding each row’s dots as you reach it. Multiplication is the quick way to say that, 4 × 5, without the long string of fives.
3. Bar Models (Tape Diagrams)
Bar models use rectangles to show how amounts relate. They’re especially handy for word problems, because they reveal the structure hiding inside the story. Which parts make up the whole? Which piece is missing?
Addition. Mia has 12 stickers, and a friend gives her 5 more. Draw one bar with a part of 12 and a part of 5. The whole bar is 12 + 5 = 17.
Finding a missing part. A bag has 20 marbles and 8 of them are red. Draw a bar for 20, mark one section as 8, and put a question mark on the rest. The missing part is 20 − 8 = 12.
Multiplication. Pencils come in packs that cost $6 each, and you buy 5 packs. Draw five equal bars of 6. Total: 5 × 6 = $30.
Division. You’ve got 32 cookies to pack evenly into 4 boxes. Draw one long bar for 32 and cut it into four equal sections. Each section is 32 ÷ 4 = 8.
Bar models are also where kids first meet ratios. A recipe that uses 2 parts flour to 3 parts sugar becomes two small bars stacked above three small bars of the same size. From there you can scale both rows up together.
The National Centre for Excellence in the Teaching of Mathematics describes the bar model as a way to show the structure of a problem, not as a calculation method on its own. I think that’s a smart way to see it.
4. Area Models
An area model uses a rectangle where the two sides are the numbers you’re multiplying. Then you chop the rectangle into smaller, friendlier pieces.
Try 12 × 14. Split 12 into 10 + 2 and 14 into 10 + 4. The rectangle breaks into four regions:
- 10 × 10 = 100
- 10 × 4 = 40
- 2 × 10 = 20
- 2 × 4 = 8
Add them together: 100 + 40 + 20 + 8 = 168.
It’s the same math as the standard method, only you get to watch every step happen. Later, this very picture helps with multiplying binomials in algebra, which is one reason teachers keep coming back to it.
Fraction multiplication works well with an area model too. Draw a rectangle and divide it with two vertical lines into three equal columns, then add one horizontal line across the middle so there are two equal rows. That leaves six equal boxes. Shade a single column to show 1/3. Next, shade one of the rows, which runs across the columns, to show 1/2. Only one box sits in both shaded areas, and it’s 1 of the 6, so 1/3 × 1/2 = 1/6. The overlap is small because you’re taking a part of a part, which is why the product of two fractions comes out smaller than either one.
A common question is how this differs from an array. In an array, each dot or counter is something you can count one by one. An area model doesn’t ask you to count anything. The rectangle’s size does the work, so it holds up when the numbers get large or when decimals are involved, and nobody has to sketch hundreds of tiny objects.
5. Fraction Bars and Fraction Models
A fraction model takes one whole, cuts it into equal pieces and shades some of them. The bottom number, the denominator, is the total count of pieces. The top number, the numerator, is how many of them you’ve shaded.
Want proof that 1/2 equals 2/4? Draw two bars the same length, one above the other. Split the top bar down the middle and shade the left half. Cut the bottom bar into four pieces and shade the first two. Both shaded stretches stop at the same spot, right at the middle. Same amount, different names.
Circles and rectangles work for this, and so does a number line. Pick whichever you like, but keep the pieces the same size. If one chunk is big and two are tiny, writing 1/3 on the big one doesn’t make it a third.
6. Base-Ten Blocks and Place-Value Models
Base-ten blocks are a set of three shapes. The little cubes are ones, the long sticks are tens, and the big flat squares are hundreds. To build 243, you’d stack up two flats, four rods and three cubes, which spells out 200 + 40 + 3 right there on the desk.
Regrouping is where the blocks really earn their place. Say a student works out 58 + 7. Eight cubes and seven cubes sit together, and that’s 15 loose ones, too many to leave as ones. So the student counts off ten, swaps them for a rod, and slides it over beside the five rods already there. Five cubes are left over. Six rods and five cubes: 65. Do that swap once with your own hands and “carrying” stops sounding like a rule someone made up. It’s just a trade, ten ones for one ten.
7. Ten Frames
A ten frame is a grid with two rows of five boxes. To show 7, fill seven boxes and leave three empty. Those empty spaces tell you right away that 7 + 3 = 10. That’s great for number bonds and early addition. You’ll mostly see ten frames with younger kids, so I’ll leave it there.
How to Choose the Right Visual Model
No single picture fits every problem. Here’s a quick guide.
| Math problem | Helpful model | Why it works |
|---|---|---|
| Counting and number order | Number line or ten frame | Shows position and quantity |
| Multiplication facts | Array | Makes equal groups visible |
| Multi-digit multiplication | Area model | Breaks numbers into easy parts |
| Word problems | Bar model | Shows parts, totals and unknowns |
| Equivalent fractions | Fraction bars | Compares equal parts of a whole |
| Place value and regrouping | Base-ten blocks | Separates hundreds, tens and ones |
| Rounding | Number line | Shows which value is closer |
If you’re not sure, ask yourself what the problem is really about. Equal groups? Try an array. Parts and a whole? Try a bar. Order or distance? Reach for a number line.
How to Solve a Problem With a Visual Model
Here’s a simple routine that works for most topics.
- Read the problem slowly and underline what you know.
- Figure out what you need to find.
- Pick a model that matches the story.
- Draw it and label every part with a number or a question mark.
- Write an equation that matches your drawing.
- Solve it, then check the answer against the original problem.
Worked example. A class has 28 students, and 12 of them are boys. How many are girls?
Draw one bar and label it 28. Split it into two sections, label one 12 and the other x. The picture is saying 12 + x = 28, so x = 28 − 12 = 16. That’s 16 girls.
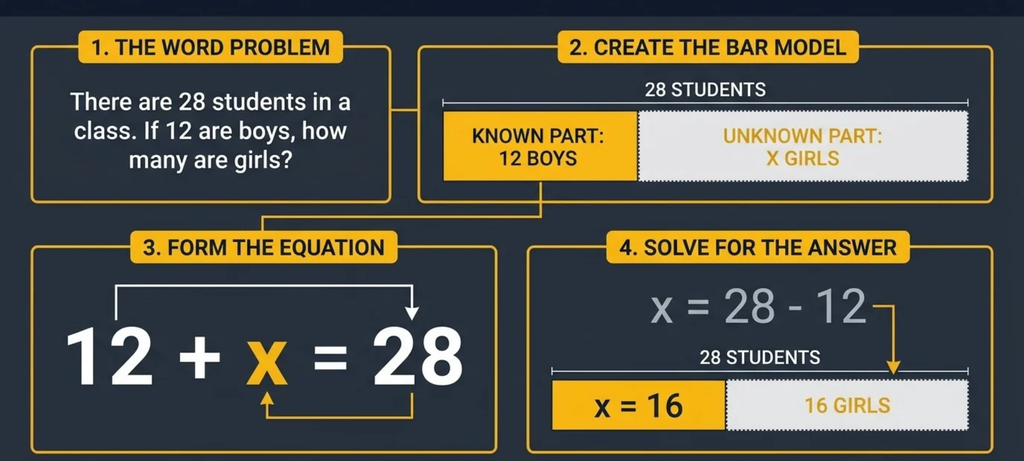
Look at what happened there. The drawing didn’t take the place of the equation. It gave you the equation. Some teachers fear pictures turn into a crutch, but if the diagram always ends in a written equation, it actually builds stronger symbol thinking. The IRIS Center at Vanderbilt makes a similar point about linking visual representations to equations.
Looking for practice? Our math puzzles for 3rd grade include problems where a quick sketch makes all the difference, and the list of 67 math games has plenty more hands-on ways to build the same skills.
Common Mistakes to Avoid
- Uneven parts. Fraction bars and array rows need to be equal in size.
- No labels. A bar without numbers is just a rectangle.
- Misleading scale. If one section is drawn twice as long, it should stand for twice the value.
- One model for everything. Using an area model on a simple subtraction story just wastes time.
- Stopping at the picture. Always connect the drawing to an equation and an answer that makes sense.
Frequently Asked Questions
What is a visual model in math example?
Three rows with four dots in each row is a simple one. It shows 3 × 4 = 12. A bar split into 12 and 5 to show 17 is another.
What does visual model mean in math?
It means a diagram, drawing or set of objects that shows quantities, operations or relationships, so you can understand them by looking.
What is a visual model for multiplication?
Arrays, area models and number lines all work. An array shows equal rows, an area model breaks a rectangle into partial products, and a number line shows repeated jumps.
What is a visual fraction model?
It’s a drawing that shows a fraction as equal parts of a whole. Shaded fraction bars, divided circles and fractions on a number line are the common ones.
What is the difference between an array and an area model?
An array arranges countable objects in rows and columns. An area model uses the size of a rectangle, so it works better with larger numbers.
Are visual models only for elementary school?
Nope. They keep showing up in middle school and beyond, helping with ratios, equations, algebra tiles and even probability trees.
Final Thoughts
So, what is a visual model in math? It’s any clear, labeled picture or arrangement of objects that lets you see how quantities connect. That could be a simple ten frame or an area model that breaks down multi-digit multiplication. The best one isn’t the fanciest. It’s the one that fits the problem and walks the learner from the drawing to an equation they really understand.


